On March 25, 2026, Apple shipped the biggest App Store Connect Analytics rebuild since the dashboard launched. Over 100 new metrics. Native MRR. Active subscriber counts. Install-to-paid conversion. Cohort analysis by download date, source, country, and offer. Anonymous peer benchmarks for download-to-paid and proceeds per download. Up to seven filter combinations on any chart. The Analytics tab also moved inside each individual app page, and the old Trends section quietly disappeared.
That update broke every other “App Store analytics” guide on Google. The top-ranking articles from AppFollow, App Radar, Adapty, and Appfigures were all written before March 2026, and they discuss removed features as if they still existed. This post is the post-update reference: every new metric explained in plain English, every gap Apple still leaves wide open, and an honest verdict on which third-party tools you still need now that the native dashboard is finally serious.
Q:What is App Store app analytics in 2026?
A: App Store app analytics is Apple's built-in analytics platform inside App Store Connect that tracks how your iOS app performs on the store. As of the March 2026 update it covers downloads, impressions, conversion rate, MRR, active subscribers, install-to-paid conversion, cohort behavior, retention, and anonymous peer benchmarks. It is free for every developer. It does NOT show keyword-level performance, competitor data, or real-time numbers, which is why most teams still pair it with a keyword tool like ASO Maniac and a review-sentiment tool like AppFollow.
- 1.100+ new metrics shipped on March 25, 2026, with MRR and cohorts now native
- 2.Peer group benchmarks compare you to similar apps without leaking data
- 3.Analytics tab moved into each app page; the Trends section was removed
- 4.Still missing: keyword-level performance, competitor data, real-time view, cross-app overview
- 5.Most indies no longer need a paid analytics tool, but the keyword blind spot remains
“App Store Connect Analytics just got a serious update. 100+ new metrics added, the ones that caught my eye: MRR, Active subscribers, Install-to-paid conversion, Cohort analysis (by country, source, download date), 7 filter combinations. Also the UI has completely changed. We used to rely on third party tools for all of this. Apple is finally offering them natively.”View on Reddit
What changed in March 2026 (the biggest Analytics update since launch)
Apple announced the rebuild on developer.apple.com and walked through the new metrics in a WWDC session. The headline numbers: 100+ new data points, two new exportable subscription reports via the Analytics Reports API, and a new App Store Analytics Guide inside App Store Connect Help. The structural change matters as much as the metrics: Analytics is no longer a global tab. Each app owns its own analytics page now.
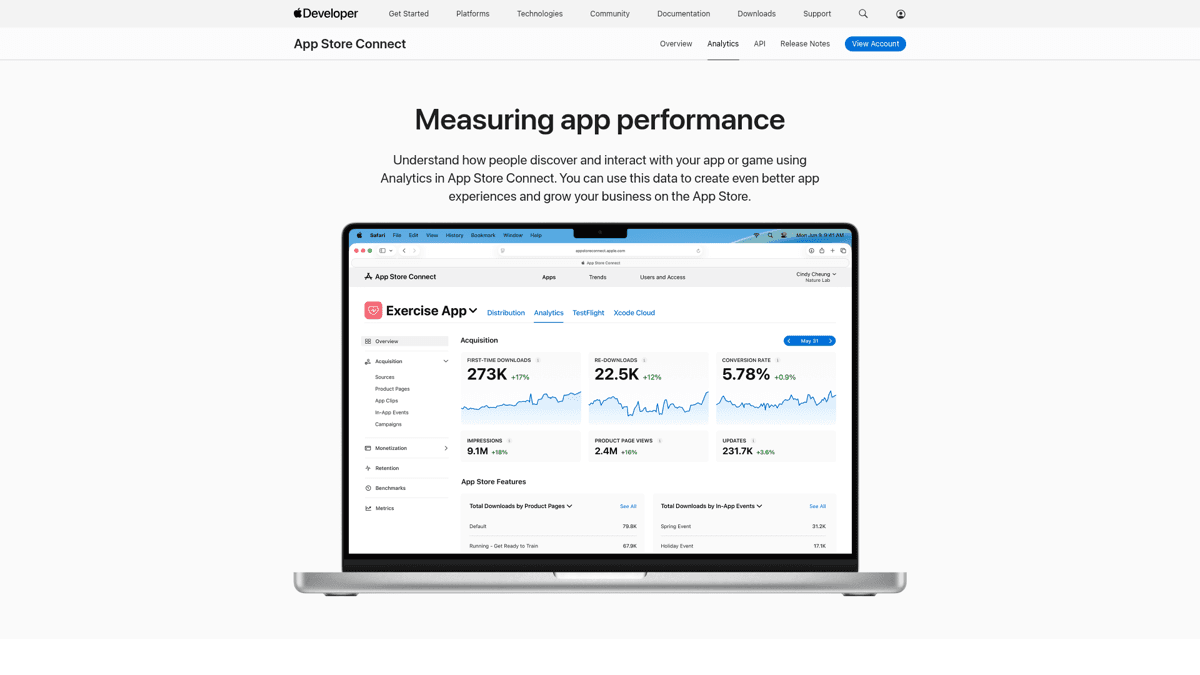
The new monetization layer: MRR, subscribers, install-to-paid
Before the update, App Store Connect would tell you how many people downloaded your app and roughly how much money you made. It would not tell you what your monthly recurring revenue was at any moment in time, or how many active subscribers you had right now, or what share of your installs eventually became paid users. For paid apps and subscription apps that is the difference between flying blind and flying with a dashboard. Those three metrics alone used to justify a $69 to $200 a month subscription to Adapty, RevenueCat, or AppFollow.
MRR and active subscribers, finally native
Apple now reports your monthly recurring revenue and active subscriber count directly in App Store Connect. Cohort splits let you see how MRR is built up by acquisition month, country, or offer. For subscription apps this is the biggest single addition in the update.
Cohort analysis without third-party SDKs
You can now slice retention and revenue by download date, by source type (App Store search vs web referrer vs Apple Search Ads), by country, and by promotional offer start date. Differential privacy is applied to peer comparisons, but your own cohorts are full precision.
Peer group benchmarks
Apple now shows you anonymous download-to-paid conversion and proceeds per download against a peer group of similar apps in your category. This is data Sensor Tower used to charge enterprise rates for. The differential privacy layer protects individual apps from being reverse-engineered.
What got removed (and what hurts about it)
The update is not all wins. Several existing features quietly vanished with the rebuild, and a chunk of the Reddit reaction is about that. Three losses stand out for portfolio developers and launch-day debugs.
⚠️ The Trends section is gone, and so is the cross-app overview
Apple removed the Trends section, which means there is no more global lifetime totals view, no same-day downloads chart, and no single page that compares all your apps side by side. The Analytics tab now lives inside each app individually. If you ship more than one app, every check now takes one extra click per app, and there is no consolidated portfolio view.
“The Analytics tab is no longer buried in the main global section, it now lives inside each individual app page. Honestly, this feels like one of those small UX tweaks that makes a huge day-to-day difference.”View on Reddit
“I miss the feature showing all lifetime downloads and sales of all apps at a glance.”View on Reddit
“Am I missing something or is there no hour-by-hour view any more? That's a key feature for me: I use it post-release to make sure I haven't screwed-up IAP or onboarding logic somewhere. Until I see an IAP purchase on each platform I don't consider my release 'done'. This is retrograde if true.”View on Reddit
The single-app placement is genuinely a UX win for solo developers with one or two apps. For anyone shipping more than three, it is a regression that nobody at Apple seems to have weighted properly. The hourly view loss is the other quiet regression: a chunk of indie developers used the hour-by-hour chart on release day to confirm that in-app purchases were firing on every territory before going to sleep.
Every metric in App Store Connect Analytics, explained
The new Analytics groups metrics into five sections. Here is what each one actually measures and what counts as a reasonable benchmark, with the caveat that benchmarks vary wildly by category. Use Apple's new peer group view inside the dashboard to anchor these against apps in your specific genre.
| Metric | What it measures | Decent indie benchmark |
|---|---|---|
| Impressions | Times your icon, screenshots, or product page appeared on the App Store | Climbs with ASO; no fixed target |
| Product Page Views | Visits to your full product page (after icon click or search tap) | 30-60% of impressions for healthy ASO |
| Conversion Rate | Percentage of impressions that became first-time downloads | 3-5% (broad), 8%+ for paid keyword targets |
| First-Time Downloads | Unique new users who installed your app | Track week-over-week trend, not absolute |
| Redownloads | Existing users reinstalling on a new device or after delete | Higher = healthy long-term brand |
| Sessions | App opens per user (engagement signal) | Daily sessions per user > 1.5 = sticky |
| Active Devices | Devices that opened the app in a given period | 30-day active / total install ratio reveals churn |
| MRR (NEW) | Monthly recurring revenue from active subscriptions | The most important number for subscription apps |
| Active Subscribers (NEW) | Subscribers currently paying you | Track the trend; isolated number is meaningless |
| Install-to-Paid (NEW) | Share of downloads that converted to paying users | 1-3% (broad), 5-10% for narrow paid niches |
| Proceeds per Download (NEW) | Average revenue Apple paid you per install | Compare against your blended CPI to size unit economics |
| Day 1 / 7 / 30 Retention | Share of users who reopen the app on each day after first launch | D1 40%+, D7 20%+, D30 10%+ is solid for utilities and games vary widely |
| Peer Group Benchmarks (NEW) | Anonymous comparison of your numbers against similar apps | Anything above peer median is a win; flag when below |
Every section of the new Analytics dashboard, with what each metric measures and a rough benchmark for indie apps.
⚠️ Treat the new retention numbers with skepticism (for now)
Multiple developers on r/iOSProgramming have reported obviously wrong retention numbers in the post-update dashboard. One subscription app showed 95% month-1 retention against a known 70% reality. Another saw retention figures between 200% and >999%. Apple may still be working out a bug in the new cohort math. Cross-check against RevenueCat or your own database before making decisions on retention alone.
“Take that data with a grain of salt as it doesn't look reliable. I just had a look at the retention numbers for one of my subscriptions and the numbers are completely off. It says 95% month 1 retention while I can clearly see in my own database that 70% percent of users cancelled right away.”View on Reddit
How to actually use the new dashboard (5 workflows that matter)
Apple piles a lot of new metrics into one page. The risk is dashboard paralysis. These five workflows cover most of what indie developers actually need on a daily and weekly basis. Treat the rest as optional.
Daily download check (now per app)
Open App Store Connect, tap the app you care about, then the Analytics tab. Filter by last 7 days and look at First-Time Downloads. Apple lags this 1-3 days, so today's number is not today's downloads.
Launch-day debugging without the hourly view
Since the hourly chart was removed, use Sales and Trends in parallel for same-day visibility. Run the daily downloads report by hour as your launch-day fallback. Cross-check against RevenueCat or your StoreKit logs for IAP confirmation per territory.
Cohort analysis for a new market launch
When you push a localized release into a new country, filter Active Subscribers by Country and Download Date. Compare the first 7 and 28 day retention curves of the new country cohort against your home country at the same point in its history.
Spotting a paywall problem with MRR + install-to-paid
If MRR is flat while First-Time Downloads is climbing, install-to-paid conversion is sinking. Drill into install-to-paid by source - if Apple Search Ads is converting at 8% and organic is at 2%, your paywall is fine and your organic ASO is bringing the wrong intent.
Reading peer benchmarks without overreacting
Peer group benchmarks are anonymized aggregates with differential privacy. A 10% gap below peer median on conversion rate is signal, a 1% gap is noise. Use peer benchmarks to validate hypotheses, not to set absolute targets.
What App Store Connect still will not tell you
Apple closed a lot of gaps in March. It did not close all of them. Four blind spots remain, and three of them have not moved in years. If your ASO strategy depends on data Apple does not collect, you still need a third-party tool. The good news is the list of what you actually need is much shorter than it was 60 days ago.
App Store Connect Analytics in 2026: where the limits are
Pros
- ✓Most accurate source for downloads, impressions, conversion (Apple's own data)
- ✓Now covers monetization deeply (MRR, active subscribers, install-to-paid)
- ✓Peer benchmarks are genuinely useful and privacy-respecting
- ✓Cohort analysis by country, source, offer, and date is free
- ✓Analytics Reports API can export the new subscription data
Cons
- ✗Zero keyword-level performance - you see impressions but never which keywords drove them
- ✗Zero competitor data - you only see your own apps
- ✗Data lags 1-3 days, no real-time view
- ✗Trends section was removed: lost lifetime totals and the hourly view
- ✗Analytics is per-app only, no cross-app portfolio overview
- ✗Reddit reports of clearly unreliable retention numbers in some accounts
“Is there any way to compare apps? For example I used to go to analytics to see all my stats for the day by app (downloads, impressions etc). Now I can only look at one app at a time? Also, if Apple gets rid of Trends, does that mean we can no longer see same day downloads and look at # of updates installed by version?”View on Reddit
The keyword blind spot Apple still has not closed
The single biggest remaining gap is keyword data. App Store Connect tells you how many impressions came from App Store Searchas a source type. It does not tell you which queries those impressions came from. A surge of organic downloads could be coming from your brand name, a competitor query you outranked, or a long-tail keyword you forgot you targeted. There is no way to tell from inside Apple's dashboard, and that gap is exactly what the third-party ASO tool category exists to fill.
The keyword-level layer Apple still does not have
ASO Maniac tracks keyword popularity (1-100), keyword difficulty, search volume, and your app's rank for every keyword you care about across the App Store and Google Play, in every country you ship to. Combine that with App Store Connect's impression and conversion data, and you get the full picture: which keywords drive impressions, which of those convert, and where to invest next. Try it at asomaniac.com.
Third-party tools after the update: still needed or redundant?
Here is the honest re-evaluation. Most indie apps used to need at least one paid third-party tool to get anything close to MRR, active subscribers, install-to-paid, and cohort data. As of March 2026 the answer for many of those use cases is “no, you do not”. But for keyword tracking, review sentiment, A/B testing, and cross-store consolidation, the gap is still real. Verdicts below, with the actual job each tool still does.
Our Verdict
🚀ASO Maniac
After Apple's update, ASO Maniac's complementary role is clearer than ever. It is the keyword-level analytics layer App Store Connect still does not have, plus rank tracking, competitor analysis, and an MCP server for AI coding agents. Indie pricing means it stays in budget even for solo developers.
Best for: Indie developers and small teams who want keyword research, rank tracking, and competitor analysis without enterprise pricing - and who use Claude Code or Cursor.
Strengths
- +Fills the keyword blind spot Apple still has
- +AI-first: works inside Claude Code, Cursor via MCP server
- +Indie pricing vs enterprise incumbents
- +API and webhook access on all plans
- +Multi-country App Store and Google Play coverage
Weaknesses
- −Newer than AppFigures or AppFollow on some app histories
- −Intentionally focused on keywords, not native analytics duplication
- −No review sentiment or A/B testing (different category)
AppFigures
Our Verdict
📊AppFigures
Still valuable for cross-store consolidation and historical keyword data, but the post-update monetization-only use case is much weaker. If you ship on both App Store and Google Play and want one dashboard for revenue and ranks, AppFigures still earns its subscription.
Best for: Cross-store developers who want App Store + Google Play + Amazon Appstore in one place.
Strengths
- +Combines App Store + Google Play + other stores in one view
- +Strong API for custom integrations
- +Long historical keyword rank data
- +Reasonable indie-tier pricing
Weaknesses
- −Subscription metrics now duplicated by App Store Connect
- −Apple's new peer benchmarks erode the competitive intelligence pitch
- −Keyword research is solid but not the deepest in the category
AppFollow
Our Verdict
💬AppFollow
Still useful for keyword tracking and review sentiment, both gaps Apple has not filled. The add-on pricing model is a constant friction point, so price it carefully against your needs. If your bottleneck is replying to App Store reviews at scale, AppFollow remains the strongest single tool for that job.
Best for: Teams whose biggest pain is review management and sentiment at scale on multiple stores.
Strengths
- +Search Visibility Score is a useful aggregate Apple does not provide
- +Strong review sentiment analysis and reply automation
- +Per-keyword tracking with history
Weaknesses
- −Heavy product placement throughout their own content
- −Add-on pricing trap: ASO and review features billed separately
- −Apple's new analytics covers most install-side metrics natively
SplitMetrics
Our Verdict
🧪SplitMetrics
Enterprise-priced and sales-led. Genuinely strong A/B testing infrastructure, but most indies should not be evaluating this. Custom Product Page experiments in App Store Connect cover the basics for free. Consider SplitMetrics only when you are running 10+ creative variants a quarter.
Best for: Large teams with dedicated growth headcount and Search Ads spend above $20K/mo.
Strengths
- +A/B testing infrastructure beyond what App Store Connect's PPO offers
- +Search Ads attribution
Weaknesses
- −Sales-led pricing kills indie use
- −Analytics is a sub-feature, not the focus
- −Custom Product Pages cover the entry-level A/B job for free
Sensor Tower
Our Verdict
🗼Sensor Tower
Different job entirely. Sensor Tower exists to give you market intelligence about your competitors, not analytics on your own app. Apple's peer benchmarks chip at the edges of that value, but you still cannot see competitor downloads or revenue estimates anywhere in App Store Connect.
Best for: Funded teams making category-level decisions about which markets and verticals to enter.
Strengths
- +Competitor revenue and download estimates
- +Deepest market data for enterprise decisions
- +Ad creative intelligence
Weaknesses
- −Estimates, not actuals
- −Out of indie budget (sales-led, typically $10k+/yr)
- −Wrong tool if you only want to track your own app
The pattern is clear. Apple closed the monetization-tracking gap. The keyword gap, the competitor gap, the review-sentiment gap, and the A/B testing gap are still wide open. Pick at most one tool per gap that actually matters to your app. Our AppFollow review and our AppTweak review go deeper on the keyword-and-review players.
Frequently asked questions
Q:What counts as an App Store impression?
A: An impression is any time your app's icon, screenshots, or product page appears on the App Store in a way that a user could plausibly see. That includes search results, category browsing, Today tab features, Featured stories, and direct product page views via deep links. Impressions are a top-of-funnel metric; conversion rate (impression to first-time download) is the diagnostic.
Q:Why does Analytics show different downloads than Sales and Trends?
A: Analytics counts unique first-time downloads per Apple ID, while Sales and Trends counts every download event (including redownloads to new devices and updates that fall under the same license). For ASO decision-making, Analytics is the right number. For financial reconciliation, Sales and Trends is the right number.
Q:How do I access the new Analytics Reports API?
A: The two new subscription reports are exposed via the existing Analytics Reports API in App Store Connect. You authenticate with an App Store Connect API key (Users and Access > Keys), then request the report endpoints for state-of-subscriptions and subscription-event reports. Apple's developer documentation walks through the JWT auth flow.
Q:Are the peer group benchmarks anonymous?
A: Yes. Apple applies differential privacy to peer group benchmark data, which means individual apps cannot be reverse-engineered from the aggregated numbers, including yours. You see your own app's actual values and a benchmark band of similar apps, but no individual competitor data is exposed in either direction.
Q:Can I still see lifetime download totals?
A: Not in the Analytics tab. The removed Trends section used to surface lifetime totals at a glance. To see lifetime numbers now you can either run a Sales and Trends report across the full date range or use a third-party tool like AppFigures that has been tracking your app since launch.
The post-update analytics audit checklist
Run this checklist once you have opened the new dashboard for the first time. If you can tick every box, you are getting full value from the rebuild. If half of these are red, the gap is your workflow, not the tool.
✅Post-update analytics audit
Walk through this list for each shipped app inside App Store Connect after the March 2026 update.
Located the Analytics tab inside each app (it is no longer in the global nav)
Confirmed Impressions, Product Page Views, and Conversion Rate are populating for the last 30 days
Reviewed MRR and Active Subscribers (subscription apps only) and confirmed numbers match RevenueCat or your own database
Checked Install-to-Paid conversion by source (App Store search vs Apple Search Ads vs web referrer)
Pulled a cohort by Download Date for your most recent country launch
Inspected Peer Group Benchmarks for download-to-paid and flagged any metric below median
Differential privacy applied - treat as direction, not absolute target
Set up the two new subscription reports via the Analytics Reports API (subscription apps)
Cross-checked retention numbers against your own database (post-update accuracy bug reported on Reddit)
Paired App Store Connect with a keyword tool to cover the keyword-level blind spot
Summary
The March 2026 App Store Connect Analytics update is the biggest single win for indie iOS developers in years. MRR, active subscribers, install-to-paid conversion, cohort analysis, and peer benchmarks are all native and free. Most teams no longer need a paid analytics dashboard purely for tracking their own app's revenue and retention.
The blind spots that remain are specific and predictable: keyword-level performance, competitor data, real-time visibility, and cross-app portfolio overview. Pick the tool that closes the gap you care about most. For most indie ASO workflows, that gap is keywords, and that is where ASO Maniac fits. Pair it with App Store Connect Analytics, drop the rest of the stack, and your dashboard is finally lean.
For more on the upstream input side of this stack, see our guides on App Store keywords, app discoverability, and Google Play ASO.